One Function is All you Need: Machine Learning Experiments with Hopsworks
Hopsworks supports machine learning experiments to track and distribute ML for free and with a built-in TensorBoard.
Introduction
Hopsworks is a single platform for both data science and data engineering that is available as both an open-source platform and a SaaS platform, including a built-in feature store. You can train models on GPUs at scale, easily install any Python libraries you want using pip/conda, run Jupyter notebooks as jobs, put those jobs in Airflow pipelines, and even write (Py)Spark or Flink applications that run at scale.
As a development environment, Hopsworks provides a central, collaborative development environment that enables machine learning teams to easily share results and experiments with teammates or generate reports for project stakeholders. All resources have strong security, data governance, backup and high availability support in Hopsworks, while assets are stored in a single distributed file system (with data stored on S3 in the cloud).
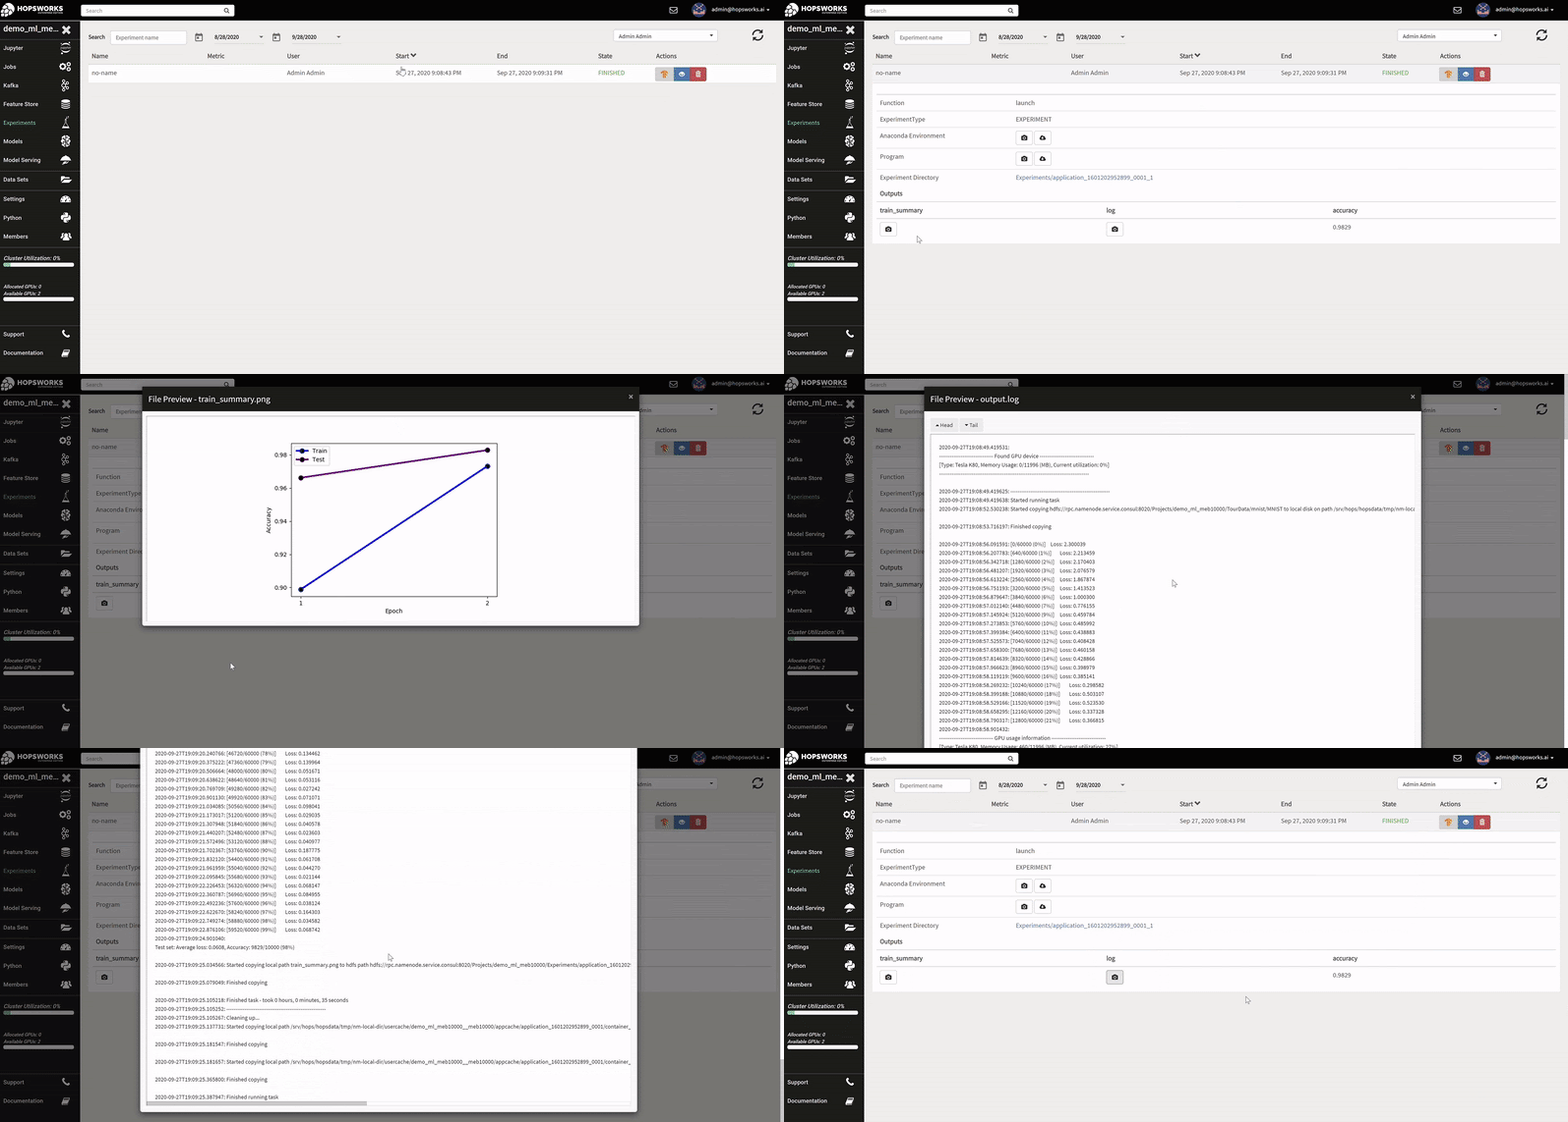
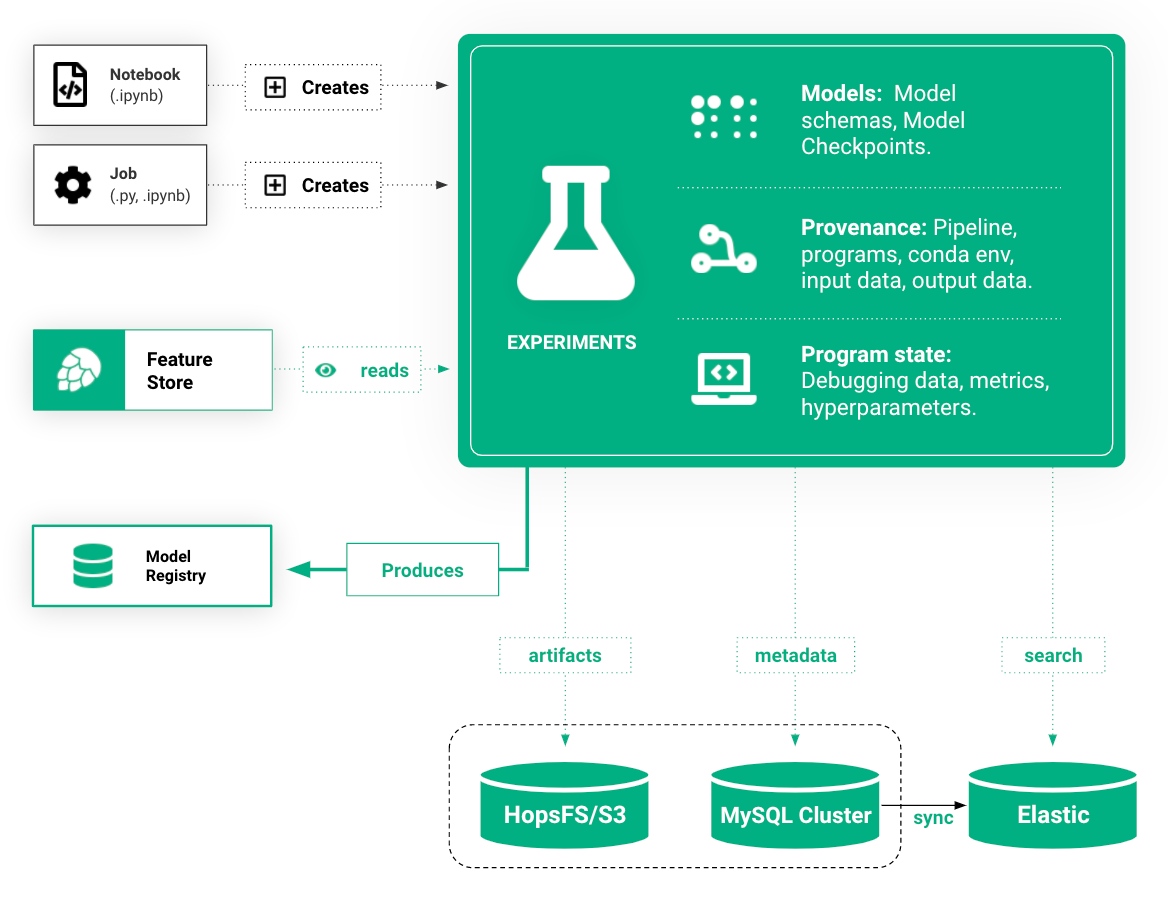
A Hopsworks ML experiment stores information about your ML training run: logs, images, metrics of interest (accuracy, loss), the program used to train the model, its input training data, and the conda dependencies used. Optional outputs are hyperparameters, a TensorBoard, and a Spark history server.
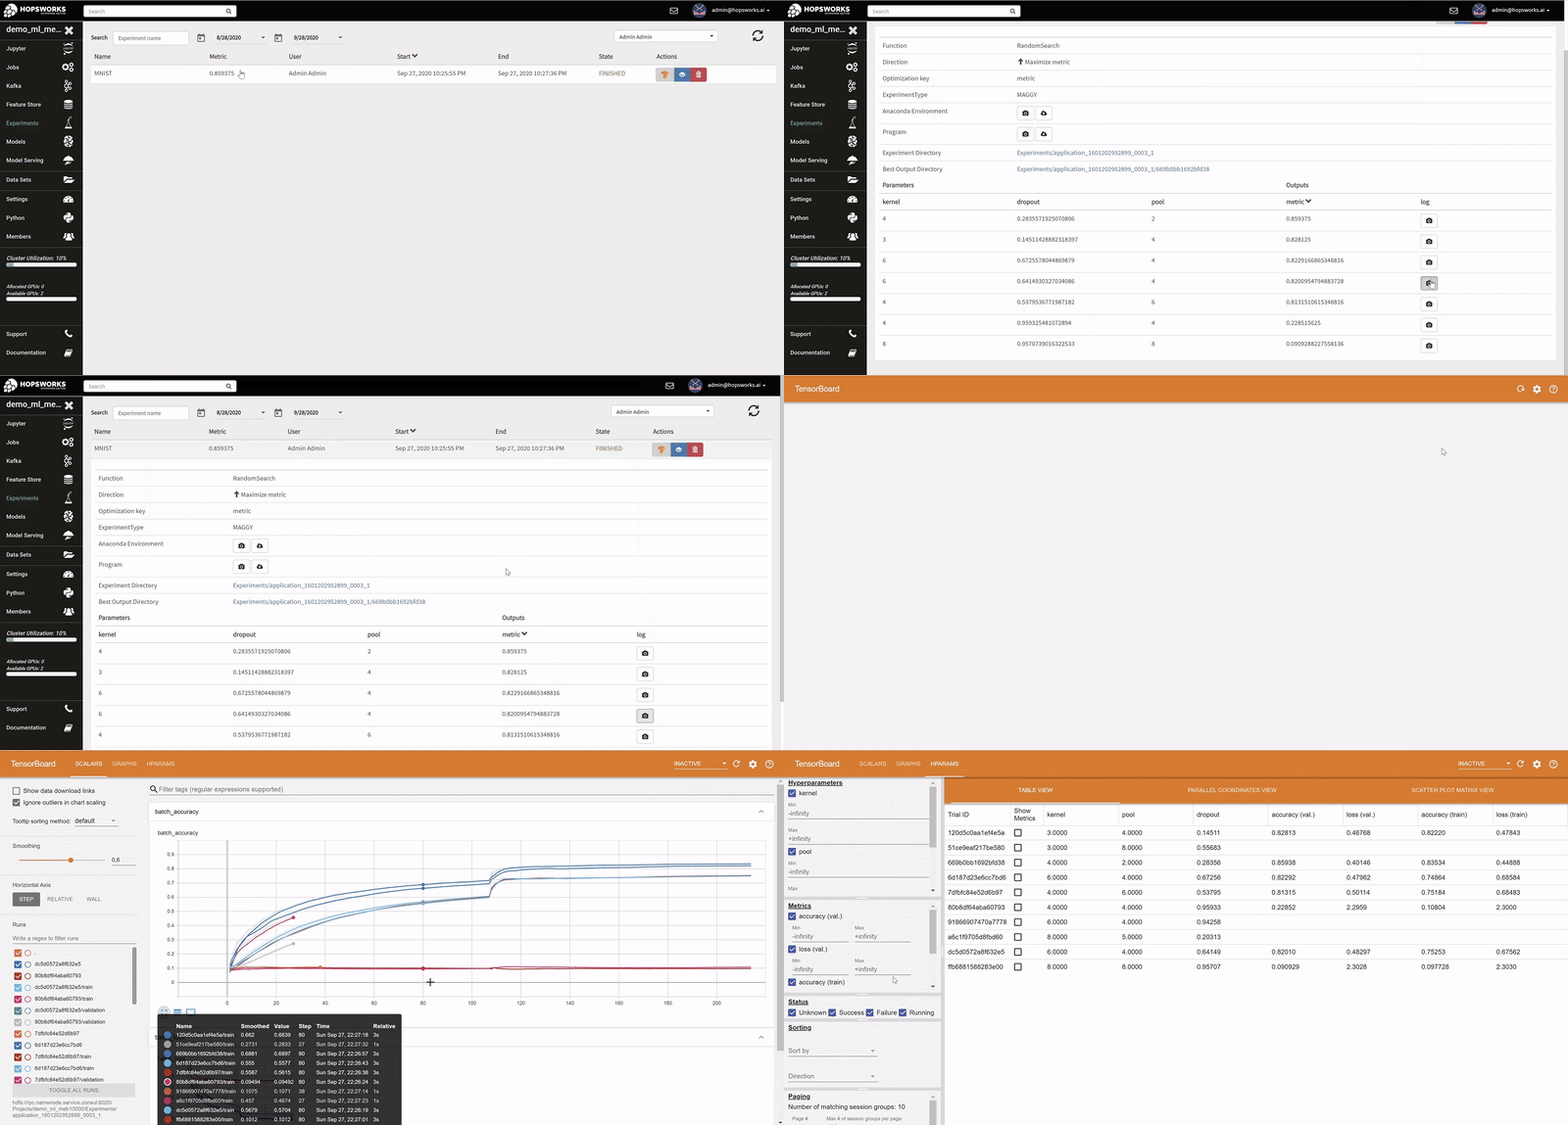
The logs of each hyperparameter trial are retrieved by clicking on its log, and TensorBoard visualizes the different trials results. The TensorBoard HParams plugin is also available to drill down further on the trials.
Tracking
When you run a Python or PySpark application on the Hopsworks platform, it can create an experiment that includes both the traditional information a program generates (results, logs, errors) as well as ML-specific information to help track, debug, and reproduce your program and its inputs and outputs:
- hyperparameters: parameters for training runs that are not updated by the ML programs themselves;
- metrics: the loss or accuracy of the model(s) trained in this experiment;
- program artifacts: python/pyspark/airflow programs, and their conda environments;
- model artifacts: serialized model objects, model schemas, and model checkpoints;
- executions: information to be able to re-execute the experiment, including parameters, versioned features for input, output files, etc;
- versioned features: to be able to reproduce an experiment, we need the exact training/test data from the run and how it was created from the feature store;
- visualizations: images generated during training and score. Also use TensorBoard to visualize training runs - Hopsworks aggregates results from all workers transparently;
- logs (for debugging): model weights, gradients, losses, optimizer state;
- custom metadata: tag experiments and free-text search for them, govern experiments (label as ‘PII’, ‘data-retention-period’, etc), and reproduce training runs.
Experiment Tracking and Distributed ML in One Library
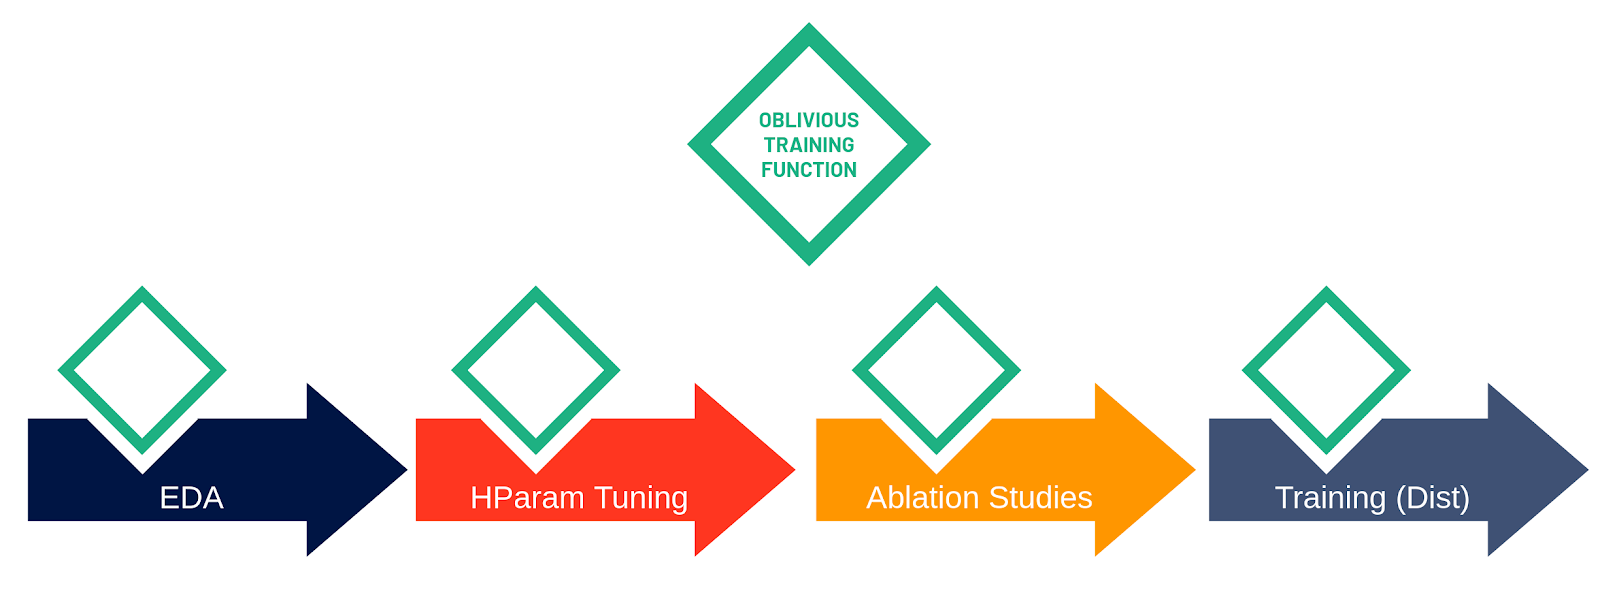
Platforms that support experiment tracking require the user to refactor their training code in a function or some explicit scope (such as “with … as xx:” in MLFlow, see Appendix A) to identify when an experiment begins and when an experiment ends. In Hopsworks, we require the developer to write their training code inside a function.
We call this Python function an oblivious training function because the function is oblivious of whether it is being run on a Python kernel in a Jupyter notebook or on many workers in a cluster, see our blog on 'Unifying Single-host and Distributed Machine Learning with Maggy' for details. That is, you write your training code once and reuse the same function when training a small model on your laptop or when performing hyperparameter tuning or distributed training on a large cluster of GPUs or CPUs.
We double down on this “wrapper” Python function by also using it to start/stop experiment tracking. Experiment tracking and distribution transparency in a single function, nice!
In Hopsworks, the Maggy library runs experiments, see code snippet above. As you can see, the only code changes a user needed compared to a best-practice TensorFlow program are:
- factor the training code in a user-defined function (def train(..):);
- return a Python dict containing the results, images, and files that the user wants to be tracked for the experiment and accessible later in the Experiments UI; and
- invoke the training function using the experiment.lagom function.
The hyperparameters can be fixed for a single execution run, or as shown in the last 4 lines of the code snippet, you can execute the train function as a distributed hyperparameter tuning job across many workers in parallel (with GPUs, if needed).
Hopsworks will automatically:
- track all parameters of the train function as hyperparameters for this experiment,
- auto-log using Keras callbacks in model.fit;
- create a versioned directory in HopsFS, where a copy of the program, its conda environment, and all logs from all workers are aggregated;
- track all provenance information for this application - input data from HopsFS used in this experiment (train/test datasets from the Feature Store), and all output artifacts (models, model checkpoints, application logs);
- redirect all print statements executed in workers to the Jupyter notebook cell for easier debugging (see GIF below - each print statement is prefixed by the worker ID).

In Hopsworks, logs from workers can be printed in your Jupyter notebook during training. Take that Databricks!
TensorBoard support
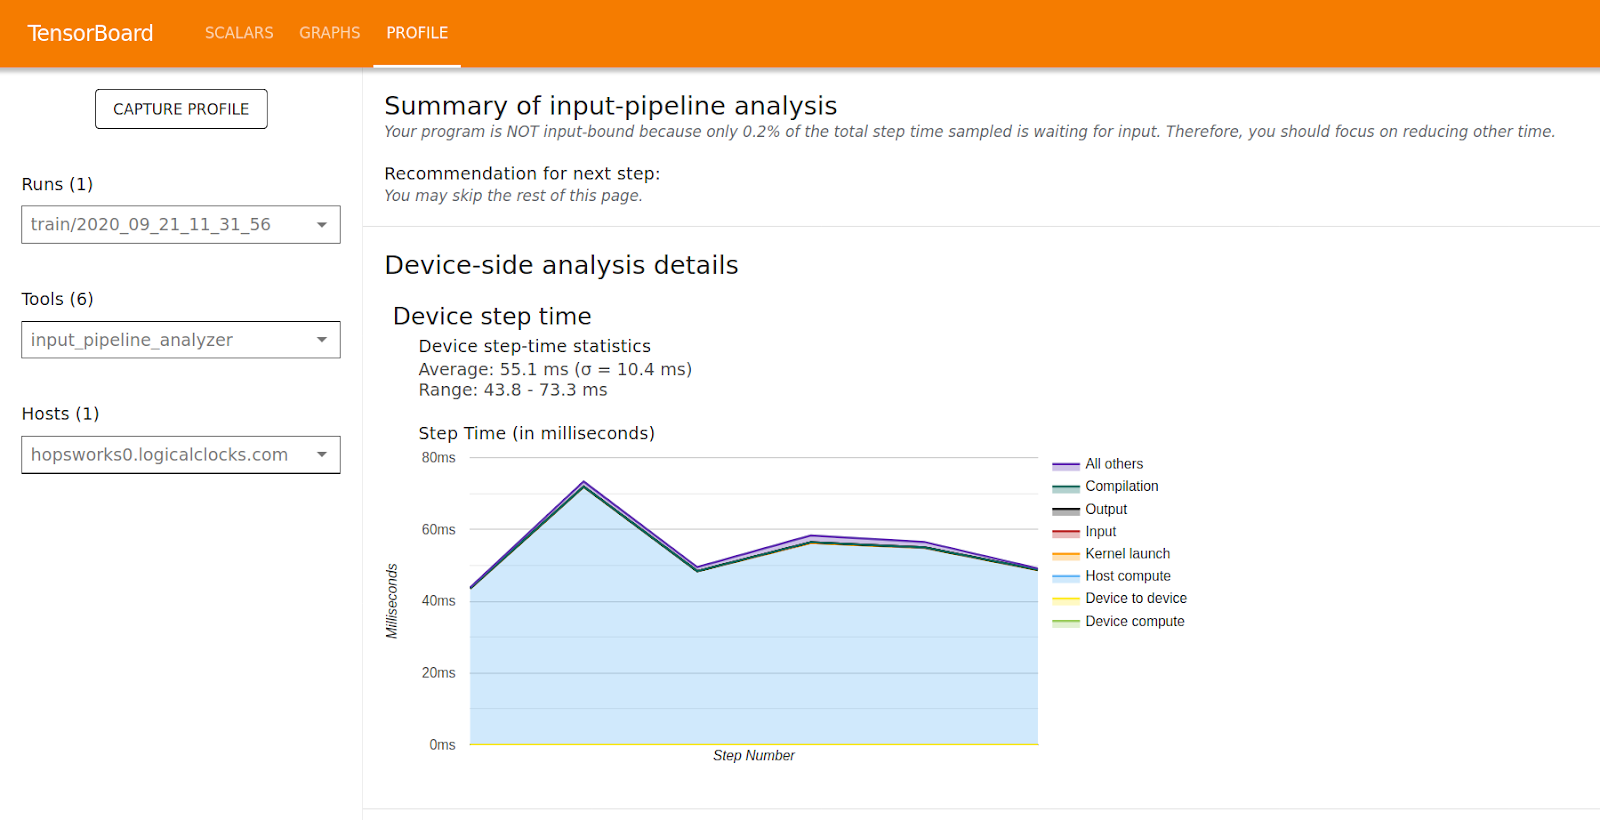
TensorBoard is arguably the most common and powerful tool used to visualize, profile and debug machine learning experiments. Hopsworks Experiments integrates seamlessly with TensorBoard. Inside the training function, the data scientist can simply import the tensorboard python module and get the folder location to write all the TensorBoard files. The content of the folder is then collected from each Executor and placed in the experiment directory in HopsFS. As TensorBoard supports showing multiple experiment runs in the same graph, visualizing and comparing multiple hyperparameter combinations becomes as simple as starting the TensorBoard integrated in the Experiments service. By default, Tensorboard is configured with useful plugins such as HParam, Profiler, and Debugging.
Profiling and debugging
Hopsworks 1.4.0 comes with TensorFlow 2.3, which includes the TensorFlow profiler. A new long-awaited feature that finally allows users to profile model training to identify bottlenecks in the training process such as slow data loading or poor operation placement in CPU + GPU configurations.
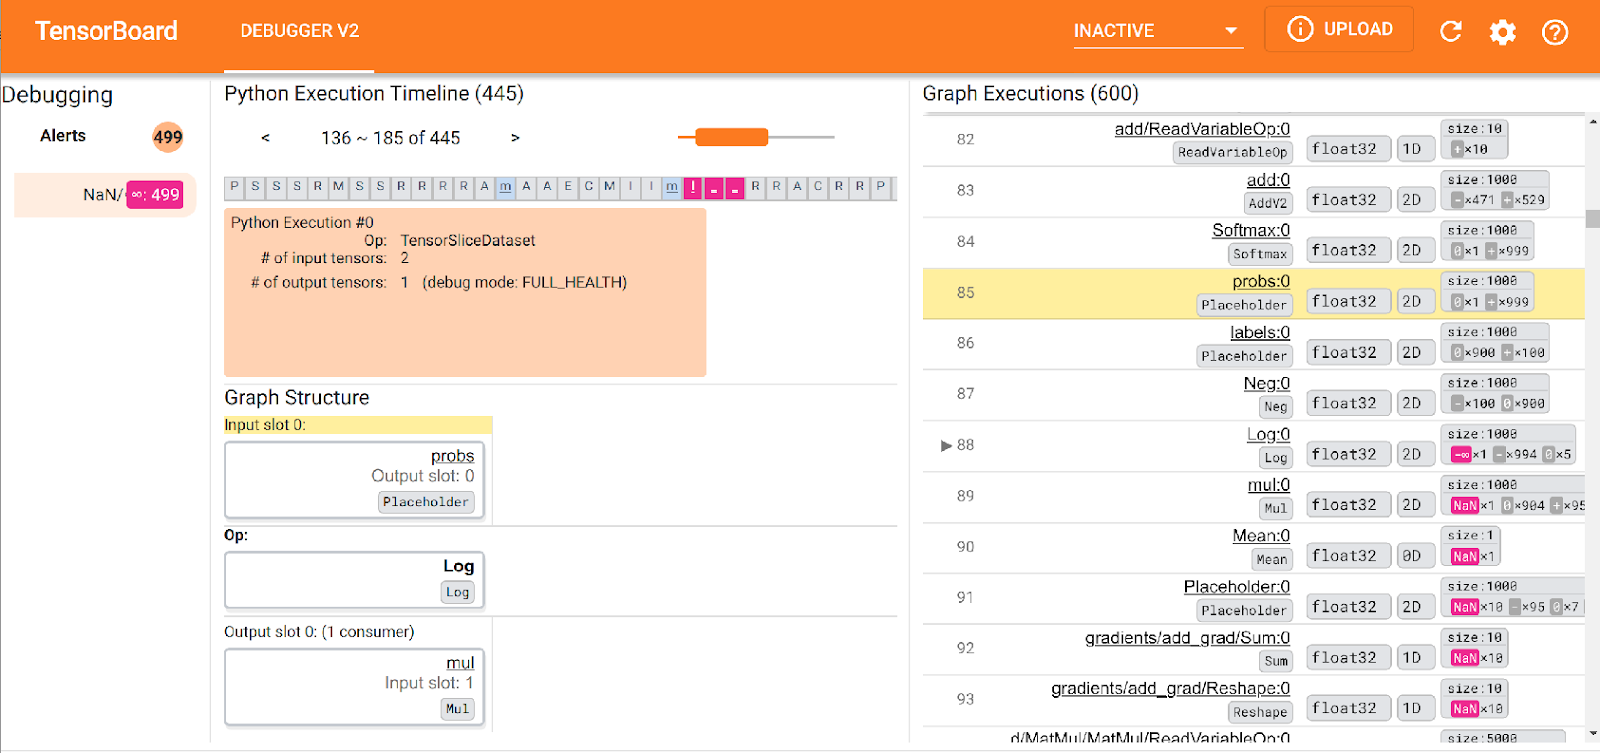
TensorFlow 2.3 also includes Debugger V2, making it easy to find model issues such as NaN which are non-trivial to find the root cause of in complex models.
Model Registry
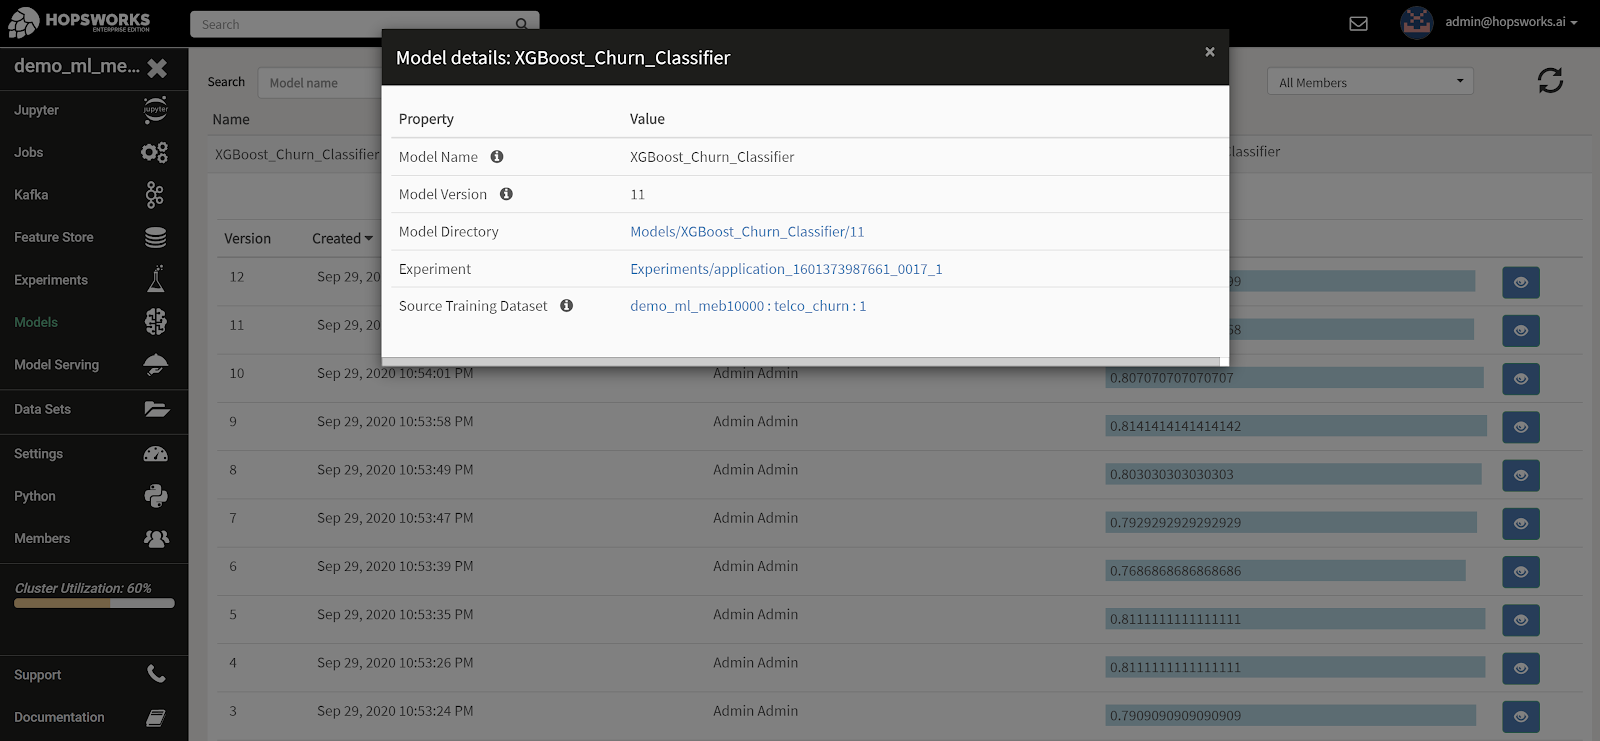
In the training code models may be exported and saved to HopsFS. Using the model python module in the hops library, it is easy to version and attach meaningful metadata to models to reflect the performance of a given model version.
The Hopsworks Model Registry, is a service where all models are listed in addition to useful information such as which user created the model, different versions, time of creation and evaluation metrics such as accuracy.
The Model Registry provides functionality to filter based on the model name, version number and the user that exported the model. Furthermore the evaluation metrics of model versions can be sorted in the UI to find the best version for a given model.
In the Model Registry UI, you can also navigate to the experiment used to train the model, and from there to the train/test data used to train the model, and from there to the features in the feature store used to create the train/test data. Thanks, provenance!
Exporting a model
A model can be exported programmatically by using the export function in the model module. Prior to exporting the model, the experiment needs to have written a model to a folder or to a path on HopsFS. Then that path is supplied to the function along with the name of the model and the evaluation metrics that should be attached. The export call will upload the contents of the folder to your Models dataset and it will also appear in the Model Registry with an incrementing version number for each export.
Get the best model version
When deploying a model to real-time serving infrastructure or loading a model for offline batch inference, applications can query the model repository to find the best version based on metadata attached to the model versions - such as the accuracy of the model. In the following example, the model version for MNIST with the highest accuracy is returned.
The Devil is in the Details
That was the brief overview of Hopsworks Experiments and the Model Registry. You can now try it out on Hopsworks or install Hopsworks Community or Enterprise on any servers or VMs you can get your hands on. If you want to read more about how we implemented the plumbing, then read on.
Transparent Distributed ML with PySpark
Hopsworks uses PySpark to transparently distribute the oblivious training function for execution on workers. If GPUs are used by workers, Spark allocates GPUs to workers, and dynamic executors are supported which ensures that GPUs are released after the training function has returned, read more about it on our blog Optimizing GPU utilization in Hops. This enables you to keep your notebook open and interactively visualize results from training, without having to worry that you are still paying for the GPUs.
The advantage of the Hopsworks programming model, compared to approaches where training code is supplied as Docker images such as AWS Sagemaker, is that you can write custom training code in place and debug it directly in your notebook. You also don’t need to write Dockerfiles for training code, and Python dependencies are managed by simply installing libraries using PIP or Conda from the Hopsworks UI (we compile the Docker images transparently for you).
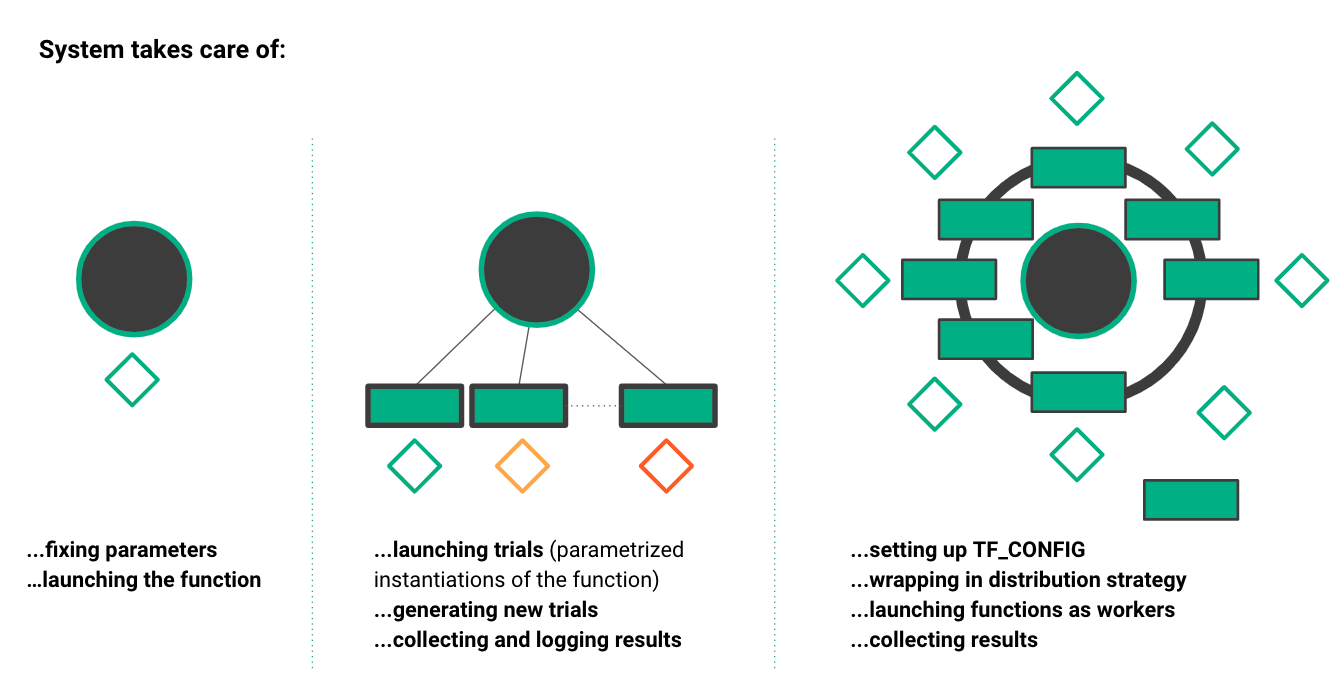
The oblivious training function can run in different execution contexts: on a Jupyter notebook in a Python kernel (far left), for parallel ML experiments (middle), and for collective allreduce data parallel training (far right). Maggy and Hopsworks take care of complex tasks such as scheduling tasks, collecting results, and generating new hyperparameter trials.
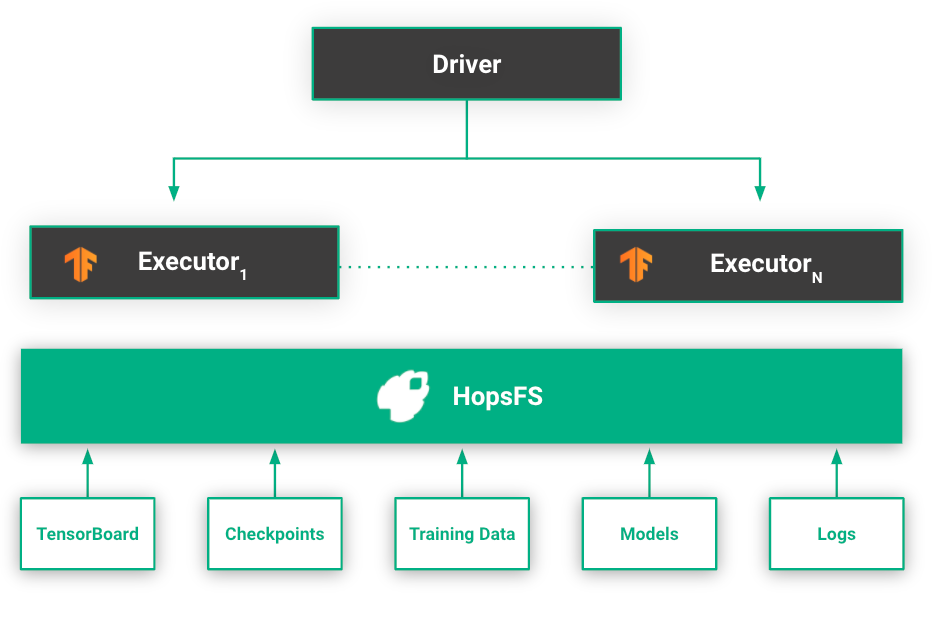
HopsFS stores experiment data and logs generated by workers during training. When an experiment is started through the API, a subfolder in the Experiments dataset in HopsFS is created and metadata about the experiment is attached to the folder. Hopsworks automatically synchronizes this metadata to elasticsearch using implicit provenance.
The metadata may include information such as the name of the experiment, type of the experiment, the exported model, and so on. As the existence of an experiment is tracked by a directory, it also means that deleting a folder also deletes the experiment as well as its associated metadata from the tracking service.
Tracking metadata with Implicit Provenance
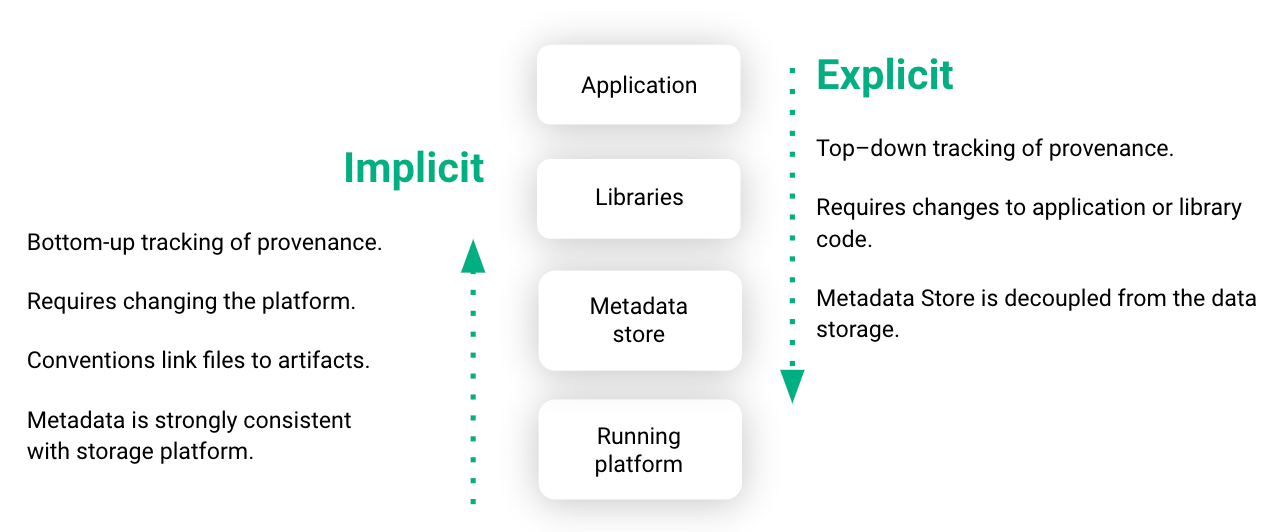
Existing systems for tracking the lineage of ML artifacts, such as TensorFlow Extended or MLFlow, require developers to change their application or library code to log tracking events to an external metadata store.
In Hopsworks, we primarily use implicit provenance to capture metadata, where we instrument our distributed file system, HopsFS, and some libraries to capture changes to ML artifacts, requiring minimal code changes to standard TensorFlow, PyTorch, or Scikit-learn programs (see details in our USENIX OpML’20 paper).
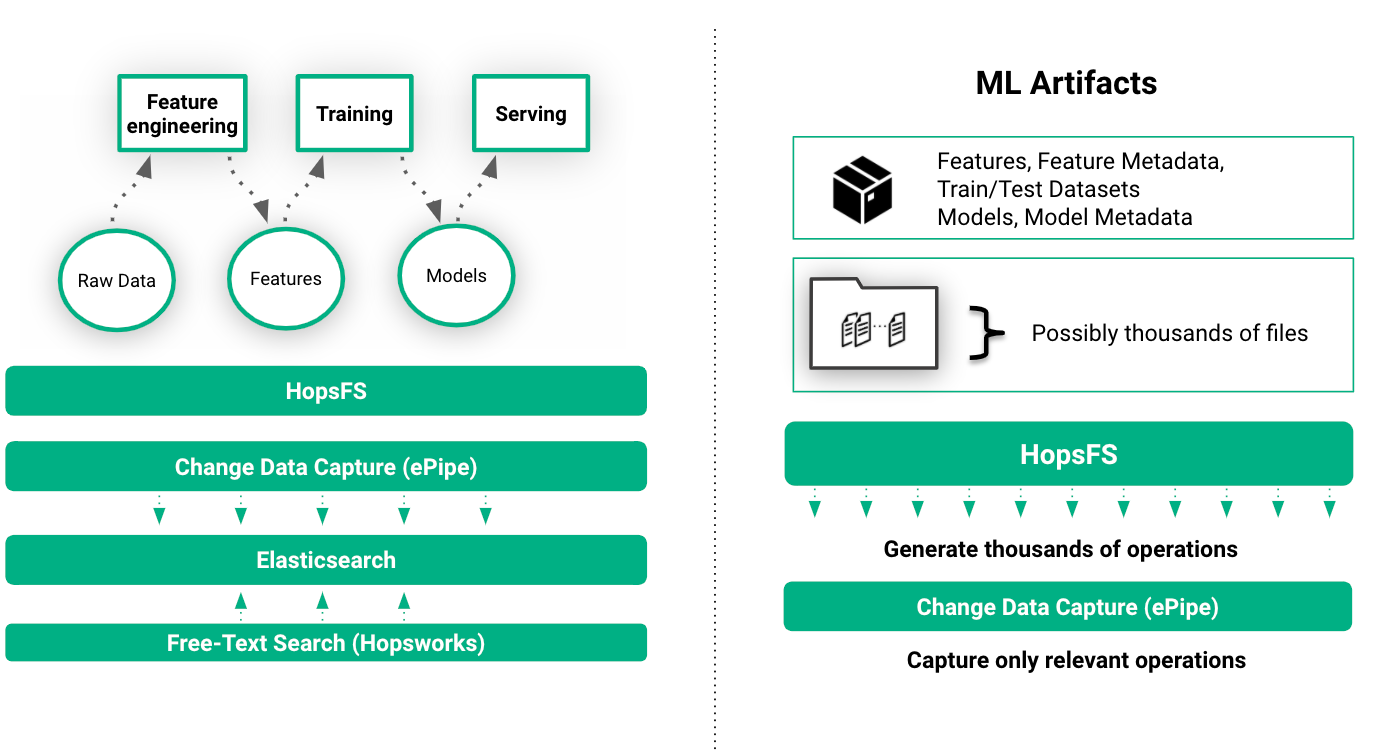
File system events such as reading features from a train/test dataset and saving a model to a directory implicitly recorded as metadata in HopsFS and then transparently indexed in Elasticsearch. This enables free-text search for ML artifacts, metadata, and experiments in the UI.
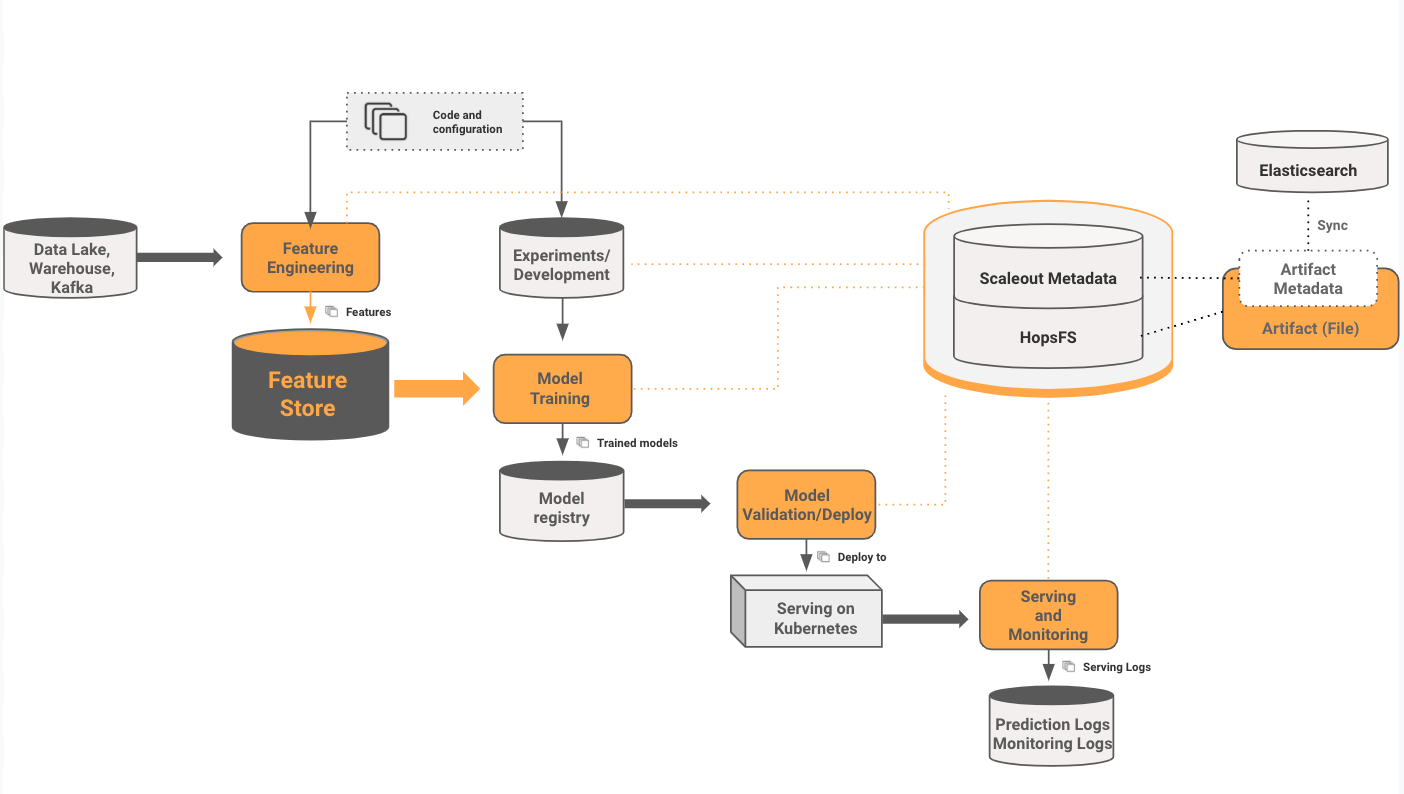
Experiments in Hopsworks are the first part of a ML training pipeline that starts at the Feature Store and ends at model serving. ML Artifacts (train/test datasets, experiments, models, etc) can be stored on HopsFS, and they can also have custom metadata attached to them.
The custom metadata is tightly coupled to the artifact (remove the file, and its metadata is automatically cleaned up) - this is achieved by storing the metadata in the same scaleout metadata layer used by HopsFS. This custom metadata is also automatically synchronized to Elasticsearch (using a service called ePipe), enabling free-text search for metadata in Hopsworks.
That’s all for now Folks!
Of all the developer tools for Data Science, platforms for managing ML experiments have seen the most innovation in recent years. Open-source platforms have appeared, such as MLFlow and our Hopsworks platform, alongside proprietary SaaS offerings such as WandB, Neptune, Comet.ml, and Valohai.
What makes Hopsworks Experiments different? You can write clean Python code and get experiment tracking and distributed ML for free with the help of implicit provenance and the oblivious training function, respectively.
There is growing consensus that platforms should keep track of what goes in and out of ML experiments for both debugging and reproducibility. You can instrument your code to keep track of inputs/outputs, or you can let the framework manage it for you with implicit provenance.
Hopsworks Experiments are a key component in our mission to reduce the complexity of putting ML in production. Further groundbreaking innovations are coming in the next few months in the areas of real-time feature engineering and monitoring operational models. Stay tuned!
Appendix A
In the code snippet below, we compare how you write a Hopsworks experiment with MLFlow. There are more similarities than differences, but explicit logging to a tracking server is not needed in Hopsworks.
Like MLFlow, but better?
Appendix B
Pipelines are the program that orchestrates the execution of an end-to-end training and model deployment job. In Hopsworks, you can run Jupyter notebooks as schedulable Jobs in Hopsworks, and these jobs can be run as part of an Airflow pipeline (Airflow also comes as part of Hopsworks). After pipeline runs, data scientists can quickly inspect the training results in the Experiments service.
The typical steps that make up a full training-and-deploy pipeline include:
- materialization of train/test data by selecting features from a feature store,
- model training on the train/test data and export the model to the Model Registry,
- evaluation and validation of the model and if it passes robustness, bias, and accuracy tests, model deployment.